How to use this R22 HOGE and HIGE calculator
- Pick your engine: Beta II (O-360) or Beta (O-320), and choose HOGE or HIGE.
- Enter your gross weight. If you have just done your weight and balance on this site, the takeoff weight carries across when you follow the hover ceiling link from the results.
- Enter the outside air temperature at the landing site or pad.
- Read the maximum hover altitude. It is a pressure altitude, so compare it with your altimeter set to 1013 hPa / 29.92 inHg, or with the site elevation corrected for QNH. The chart shows the POH OAT lines, your interpolated OAT line in blue, and the crosshair going up from your weight and across to the answer, exactly as you would rule it on the paper chart.
How the R22 hover ceiling chart works
The POH charts plot gross weight against pressure altitude with one line per 10°C of outside air temperature. To read one by hand you go up from your gross weight to your OAT line, then across to the altitude axis and read the maximum pressure altitude. Between two OAT lines you interpolate. This calculator does exactly that: each POH line is stored as a series of points, the two lines either side of your temperature are read at your weight, and the answer is interpolated linearly between them, the same method as in the Tool in the Cockpit app. The crosshair on the chart is the ruler.
Every line starts at the dashed 12,600 ft density altitude limit. Above that Robinson has not substantiated hover performance, so the calculator caps the answer there for light weights and tells you when the limit, rather than engine power, is what stops you. On the OGE charts the lines bend sharply in the last 40 lb before maximum gross weight, which is where full throttle runs out; the calculator follows those knees.
The conditions are the POH ones: zero wind, takeoff power or full throttle at 104% RPM for OGE, full throttle at a 2 foot skid clearance for IGE. Performance under other conditions may be substantially less.
Which R22 hover charts are included
- R22 Beta II (O-360): HIGE and HOGE, R22 POH Section 5, OGE chart FAA approved 23 Feb 2004, IGE chart 13 Oct 2000. OAT lines from -20°C to +40°C, density altitude limit 12,600 ft, 17 knot IGE controllability to 9,800 ft density altitude.
- R22 Beta (O-320): HIGE and HOGE, R22 POH Section 5, OGE chart FAA approved 23 Feb 2004, IGE chart (HP, Alpha and Beta) 13 Oct 2000. OAT lines from -20°C to +40°C, density altitude limit 12,600 ft.
R22 hover ceiling FAQ
What is the difference between HIGE and HOGE?
HIGE is hover in ground effect, measured at a 2 foot skid clearance in the R22 POH. The ground cushion reduces the power needed, so HIGE ceilings are higher than HOGE. HOGE is hover out of ground effect, which is what you need for a vertical departure or arrival over obstacles, a confined area or a pinnacle. If your HOGE ceiling is below the landing site elevation, you can still land and lift off in ground effect, but you have no margin to hover away from the ground.
What is the R22 HOGE ceiling at max gross weight?
On a standard day the R22 Beta II can hover out of ground effect at 1,370 lb up to roughly 5,100 ft pressure altitude; at ISA +20 that drops to about 3,000 ft. The Beta (O-320) at 1,370 lb hovers OGE to about 5,000 ft on a standard day. In ground effect the Beta II manages about 9,400 ft and the Beta about 7,000 ft at max gross. At 1,200 lb the Beta II HOGE ceiling is over 10,000 ft. Use the calculator above for your exact weight and temperature.
Which R22 hover chart should I use?
The Beta II (O-360-J2A, derated) has its own OGE and IGE charts, pages 5-10 and 5-6 of the R22 POH. The Beta (O-320-B2C) uses the OGE chart on page 5-9 and shares the IGE chart on page 5-5 with the HP and Alpha. All of them are limited to 1,370 lb except the Standard and HP at 1,300 lb, whose charts are not included here. Pick the matching engine in the calculator and check your own POH for any later revision.
What does the 12,600 ft density altitude line mean?
Robinson only substantiates R22 hover performance up to 12,600 ft density altitude. That is the dashed line at the top left of each POH chart, and every OAT line starts on it. For light weights the calculator caps the maximum hover altitude there and tells you so, because the POH gives no data above it. Separately, IGE hover controllability in a 17 knot wind is only substantiated up to 9,800 ft density altitude on the Beta II.
The answer is a pressure altitude. How do I compare it with my landing site?
Set 1013.25 hPa (29.92 inHg) on the altimeter subscale and read the altitude, then check it is below the maximum hover altitude. If you only know the site elevation and the QNH, add roughly 27 ft for every hPa the QNH is below 1013 (about 1,000 ft per inch of mercury below 29.92), or subtract if it is above.
Why is the R22 hover ceiling so sensitive to weight?
The R22 has the least power margin of the Robinson range. On the Beta II OGE chart each 25 lb costs roughly 450 to 500 ft of hover ceiling, and near maximum gross the lines bend sharply where full throttle runs out, so the last 40 lb can cost 2,000 ft. A student and instructor with full fuel on a hot day are often HOGE-limited at sea level.
Does the calculator account for wind?
No. The POH charts are for zero wind. A headwind gives you translational lift and improves hover performance, so zero wind is the conservative case, but a tailwind or gusty conditions can make things worse than the chart. Also remember the 17 knot controllability limit for IGE hover above 9,800 ft density altitude.
Is this R22 hover ceiling calculator free?
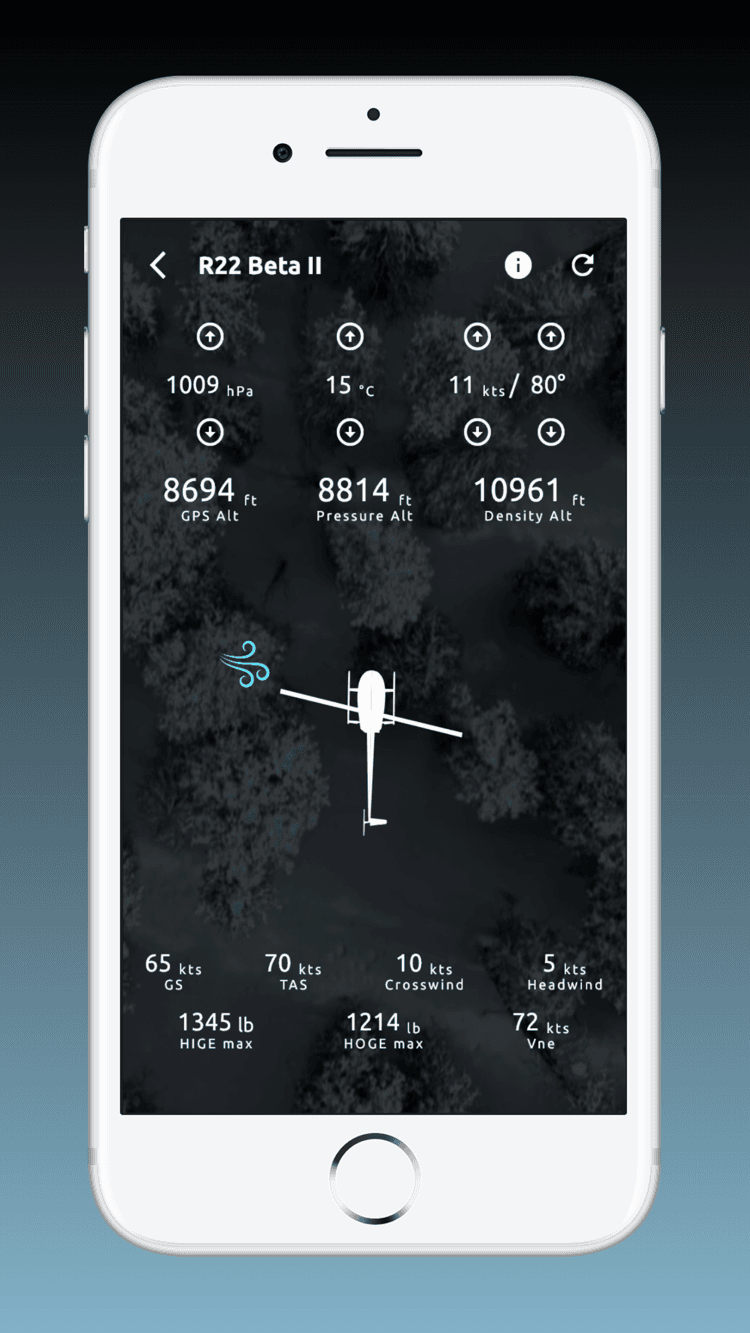
Yes. It runs entirely in your browser with no account. The Beta II IGE lines come from the Tool in the Cockpit app and were checked against the R22 POH chart; the Beta II OGE and both Beta charts were digitised directly from the POH. If you want the same charts offline on your phone, with HIGE and HOGE updating live from GPS altitude and temperature in flight, download the free Tool in the Cockpit app.